


2026 Precious Metals Overview
Gold: Results of the Year
2025 proved to be an exceptional year for gold: prices reached record highs more than 50 times, while the cumulative year-to-date surged more than 60%. This rally was driven by a combination of factors.
First, unprecedented high levels of geopolitical and economic uncertainty fueled demand for safe-haven assets, giving gold a significant premium boost. According to estimates by the World Gold Council (WGC), elevated geopolitical risks and global macroeconomic uncertainty account for approximately 12 percentage points of gold’s price increase in 2025.
Second, weakening of U.S. dollar and a slight decline in real interest rates reduced the alternative cost of holding gold, adding another 10 percentage points to its return.
Taken together, these two groups of factors accounted for approximately half of the growth, underscoring the significant influence of central bank policies and monetary conditions on the gold market. Other drivers also contributed significantly: positive price dynamics and investor fund flows (momentum) added about 9 percentage points, while the improved economic conditions contributed a further 10 percentage points.
Notably, the contribution of key factors to gold’s price growth in 2025 was unusually well balanced, with no single driver dominating. This suggests that the market growth was broad-based: from rising defensive demand to improving fundamentals, with price momentum (speculative demand) playing a somewhat more pronounced role than in previous years.
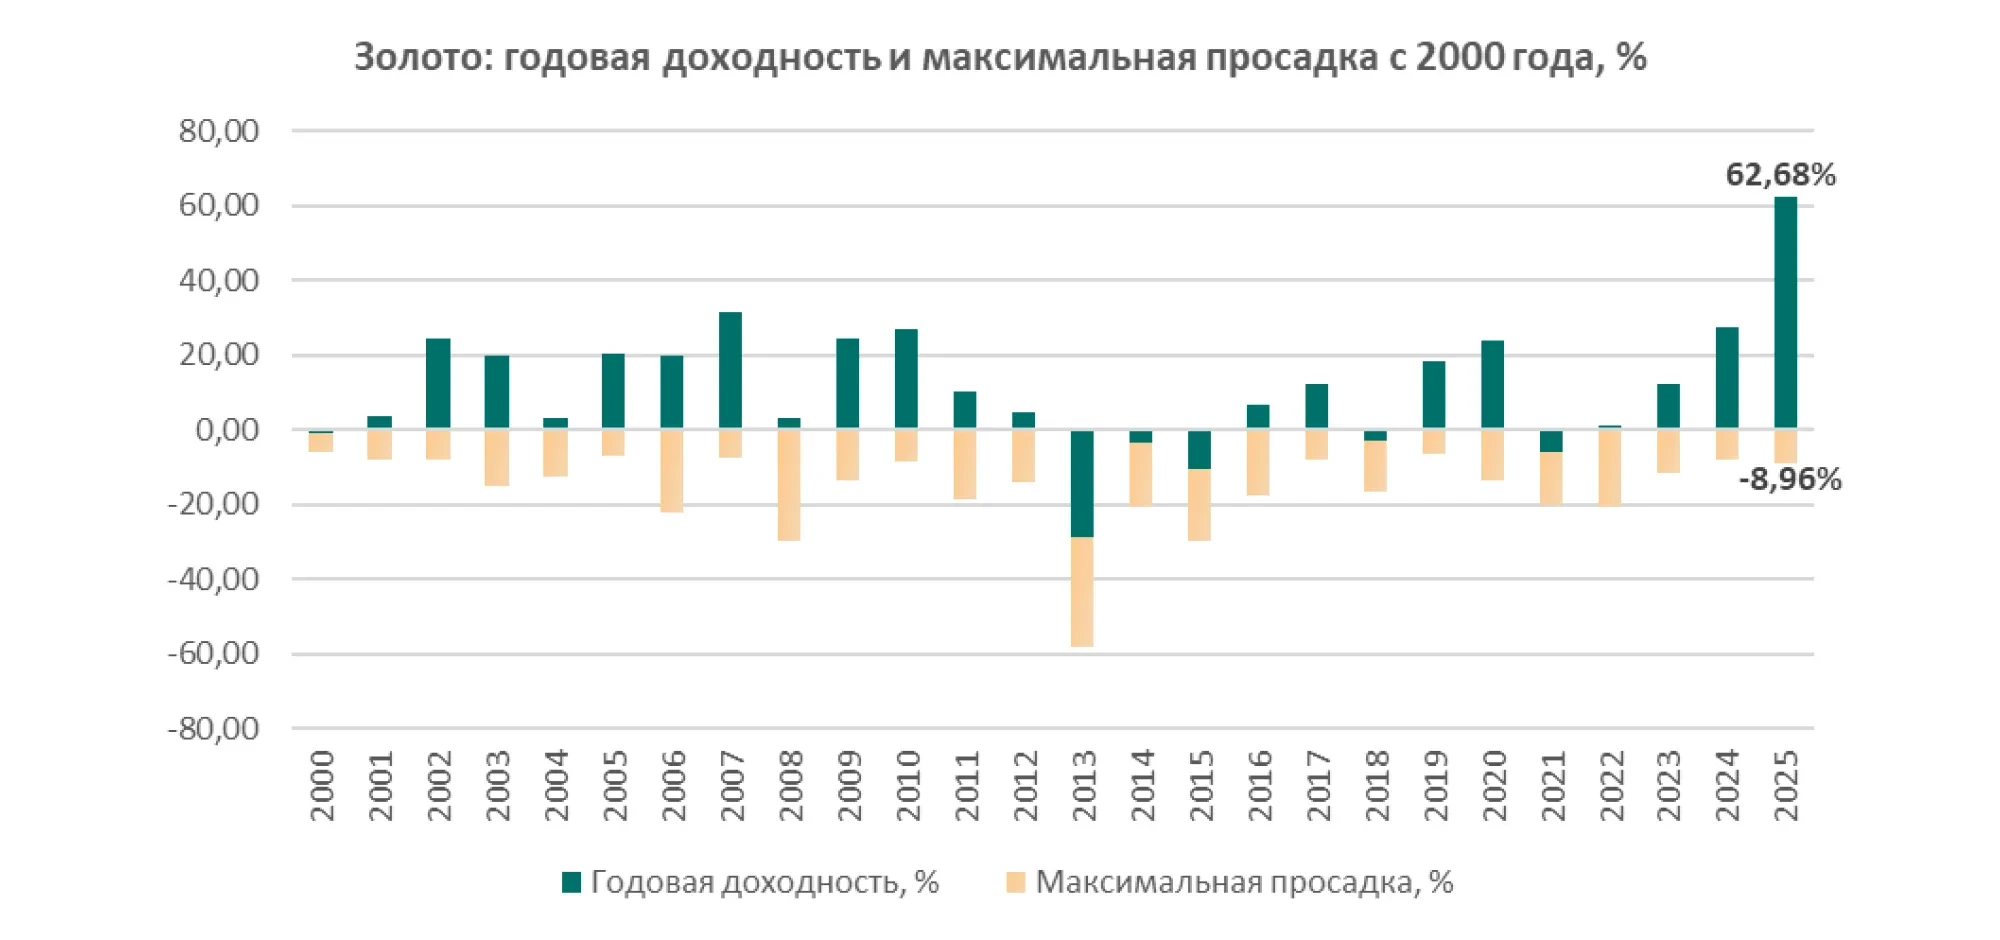
Source: Bloomberg; Calculations and Visualization: BCC Invest.
Investment Demand and Central Bank Purchases
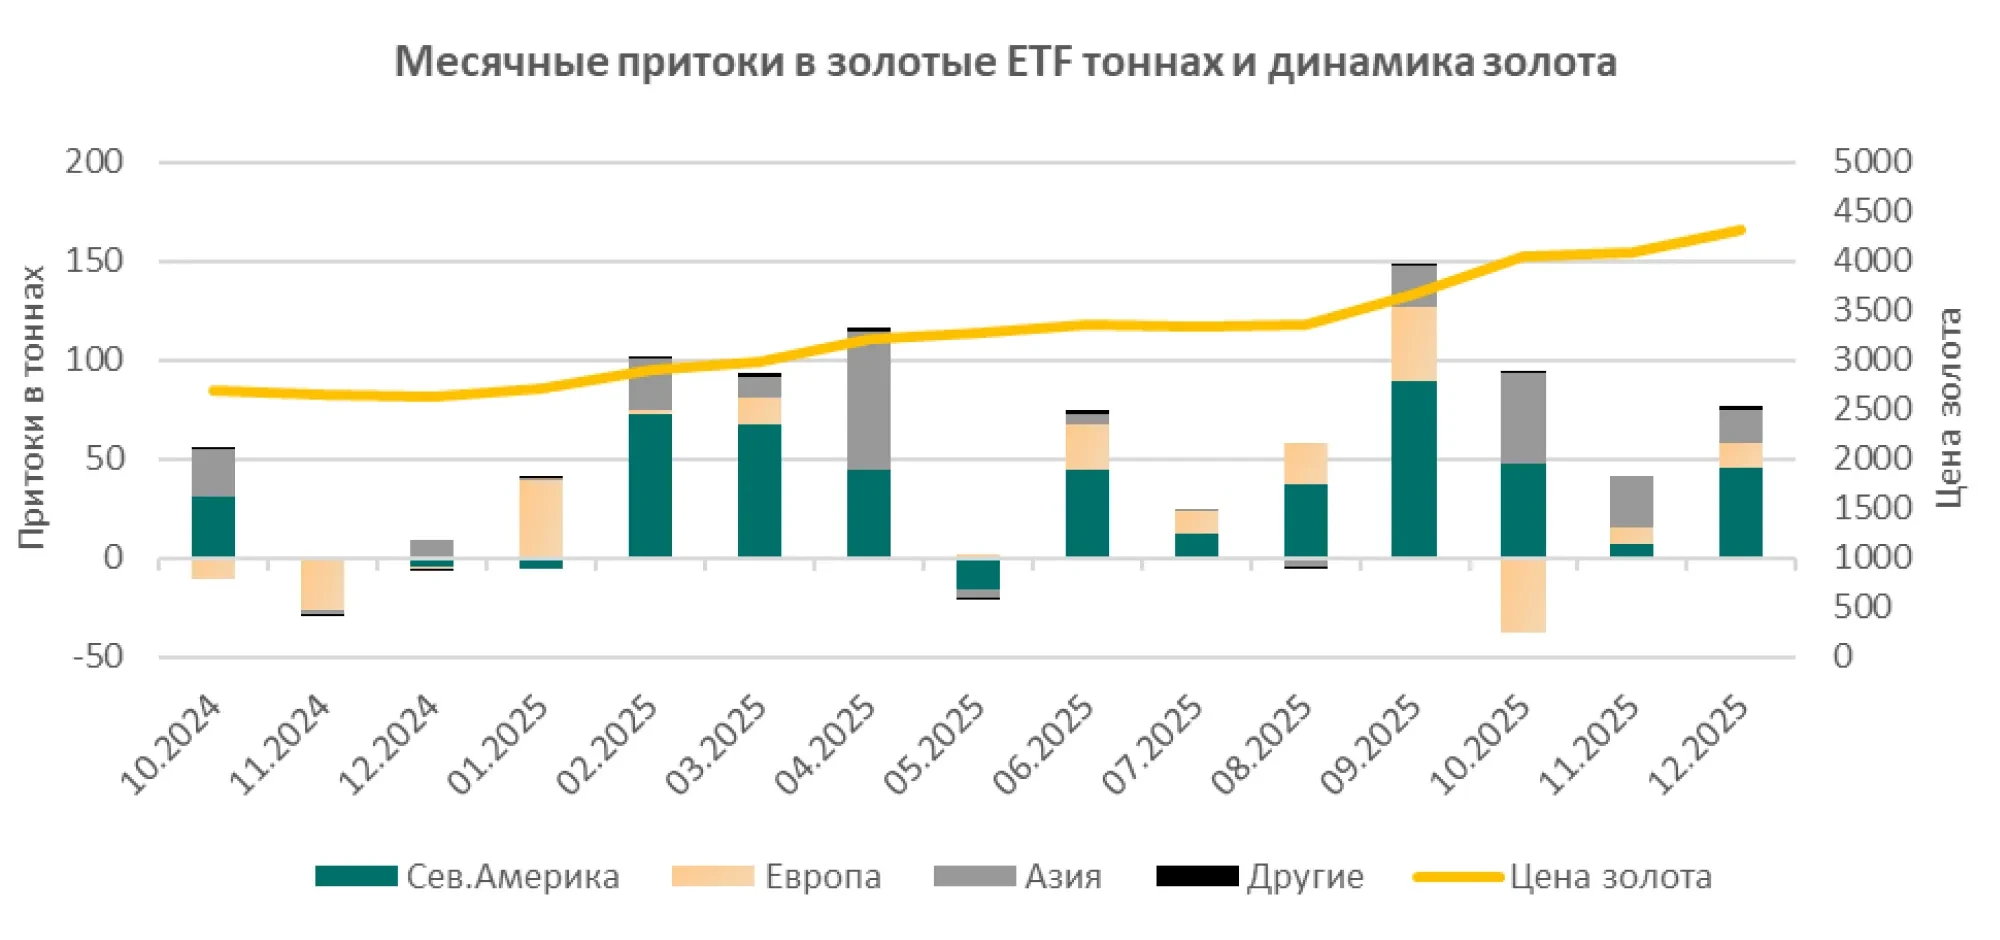
Investment demand and central bank purchases played a pivotal role in the rally. Amid declining yields on other assets and concerns about equity market overheating, investors stepped up diversification into gold.
Flows into gold-backed exchange-traded funds (ETFs) turned upward: in 2025, ETFs almost fully offset the outflows of the previous four years, demonstrating record monthly inflows (around $17 billion in September alone) - the largest monthly inflow ever recorded.
Overall, during the July–September quarter, total inflows into gold ETFs reached $26 billion, an all-time high. These large-scale investments, together with sustained demand from central banks, pushed total global gold demand close to 4,850 tonnes in 2025, the highest level since 2011.
Central banks continued to actively purchase gold for their reserves, albeit at a slower pace compared with the record levels of the previous three years. Central bank demand remains well above historical averages, reflecting ongoing efforts toward de-dollarization and hedging against geopolitical risks. For example, gold currently accounts for only about one-third of the share in the reserves of emerging market central banks compared with those of advanced economies, and many EM central banks plan to further increase their gold reserves to diversify and mitigate sanctions and currency risks.
In the private sector, gold is similarly underrepresented in portfolios. According to estimates by UBS analysts, gold currently accounts for only 0.4% of global investment assets, compared with 5–10% that was routinely observed in previous decades. This points to significant potential for further capital inflows into the gold sector should market volatility persist.
The market received additional support in 2025 from geopolitical factors: ongoing military conflicts and escalation of geo-economic tensions increased gold’s appeal.
According to the WGC estimates, political instability was one of the key contributors to price growth, with geopolitical risk (e.g., related risk premiums) accounting for about 8 percentage points of the total 60% return.
To sum up, 2025 marked strengthening of gold’s position as a high-yield asset amid turbulence. Gold ranked among the best-performing asset classes of the year, outperforming many equity indices and commodities, while reaffirming its status as an effective safe-haven instrument.
Source: World Gold Council
2026 Expectations and Scenarios
Current prices largely reflect consensus expectations regarding economic growth, inflation, and monetary policy; as a result, under a stabilized macroeconomic conditions, gold may remain within a relatively narrow range. The World Gold Council describes this status quo as the “Macro consensus” scenario, when gold price movements in 2026 are estimated to be within 5% of current levels. However, as experience shows, reality rarely adheres strictly to the consensus path. The WGC and major banks consider several alternative scenarios that incorporate potential deviations of economy from the baseline.
In the baseline scenario adopted by most banks for 2026, global economy is expected to slow gradually, with an easing of monetary policy. This means that no significant move in gold prices is anticipated, although a moderate upward trend will persist. Market consensus estimates also point to prices remaining close to current levels with scope for slight growth: on average, forecasts range from $4,300 to $4,700 per ounce by the end of 2026. At the same time, gold futures and forward curves signal continued backwardation, reflecting expectations of a partial normalization of demand following the exceptionally strong 2025.
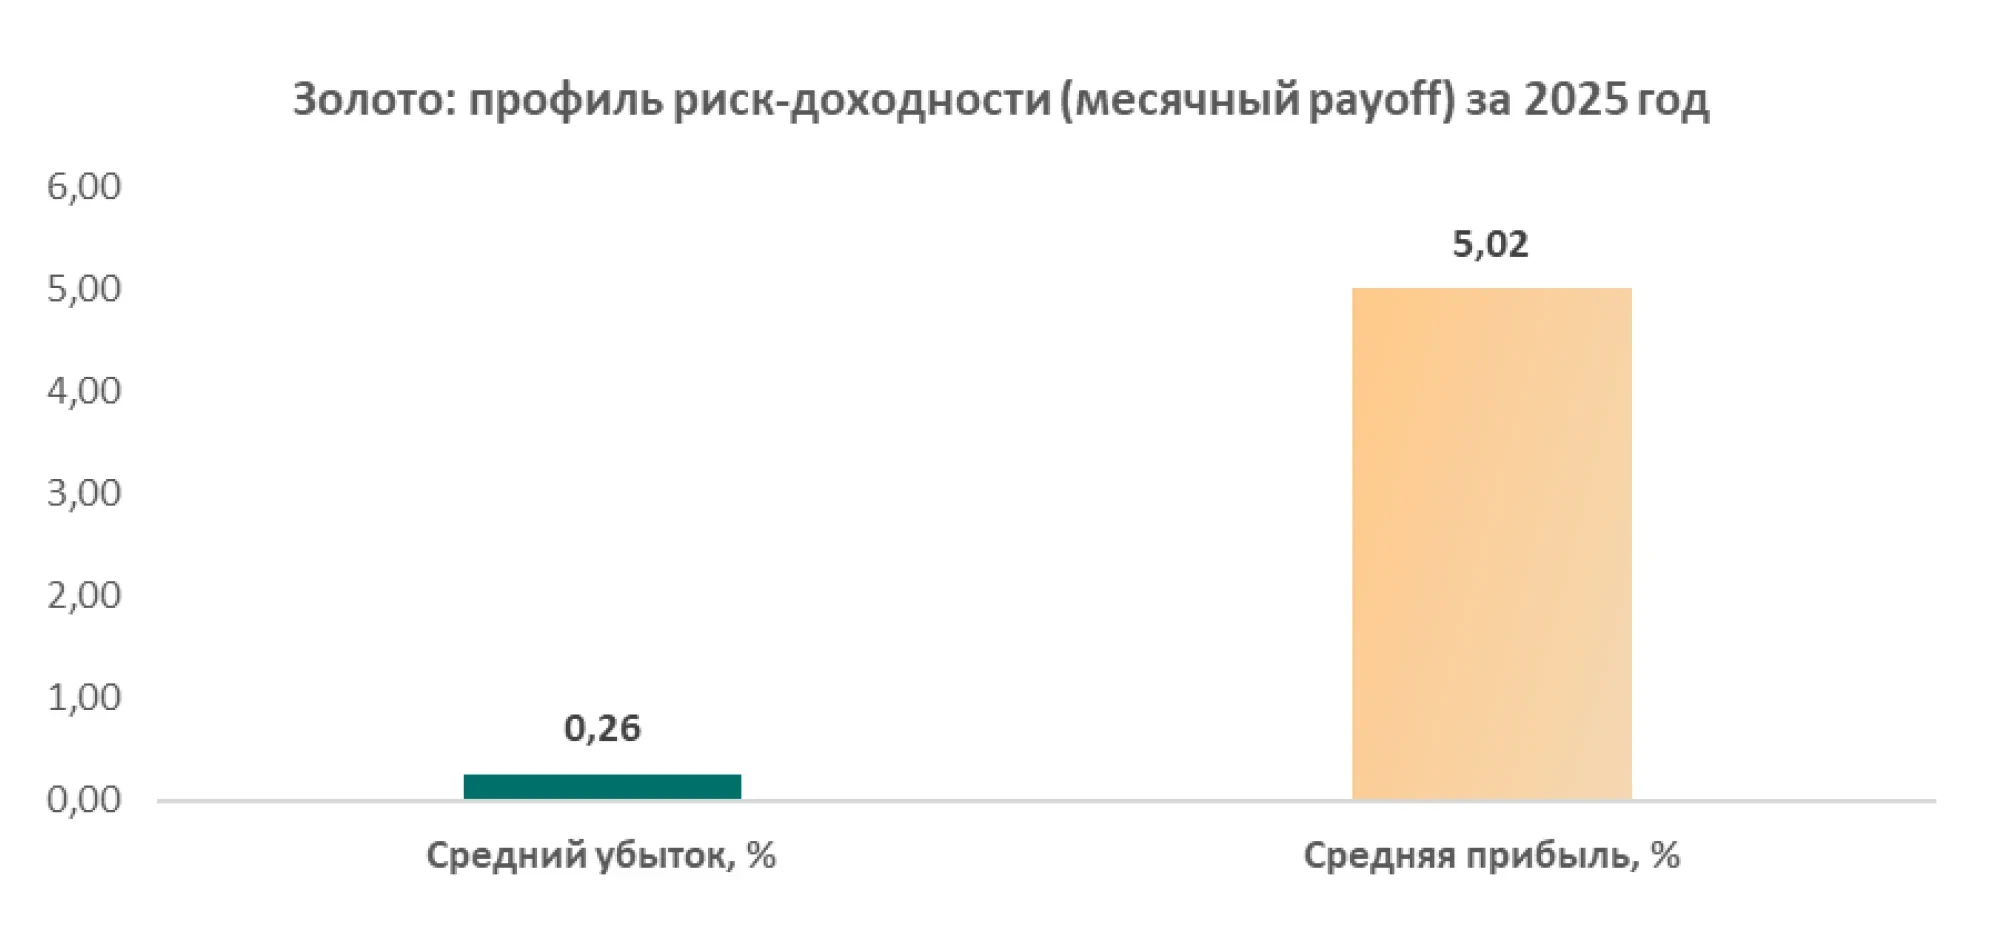
It is also important to emphasize gold’s role in portfolios under conditions of volatility, which remains relevant across all scenarios. Gold has proven to be an effective diversifier: its correlation with risky assets (equities and high-yield bonds) is usually negative during periods of crisis, helping to smooth out portfolio drawdowns. The year 2025 provides a clear illustration that the inclusion of gold delivered a meaningful positive effect on balanced portfolios, offsetting weakness of bonds and elevated stock volatility.
In 2026, a high level of uncertainty is expected to persist (geopolitical conflicts, fiscal challenges in a number of countries, and tail-risk events). As a result, investors are likely to maintain their interest in defensive assets.
Gold continues to serve a hedging function within portfolios, and the current price pullbacks offer an opportunity to increase gold exposure to an optimal 5% of the portfolio without taking on excessive risk. The key factor remains gold’s stabilizing role: the metal enhances diversification and reduces overall investment volatility, particularly during heightened market fluctuations.
Therefore, entering 2026, gold retains its dual nature: on the one hand, the potential for rapid growth is limited in the absence of new shocks; on the other, the metal remains in high demand as a hedge against unforeseen events and a tool for capital preservation.
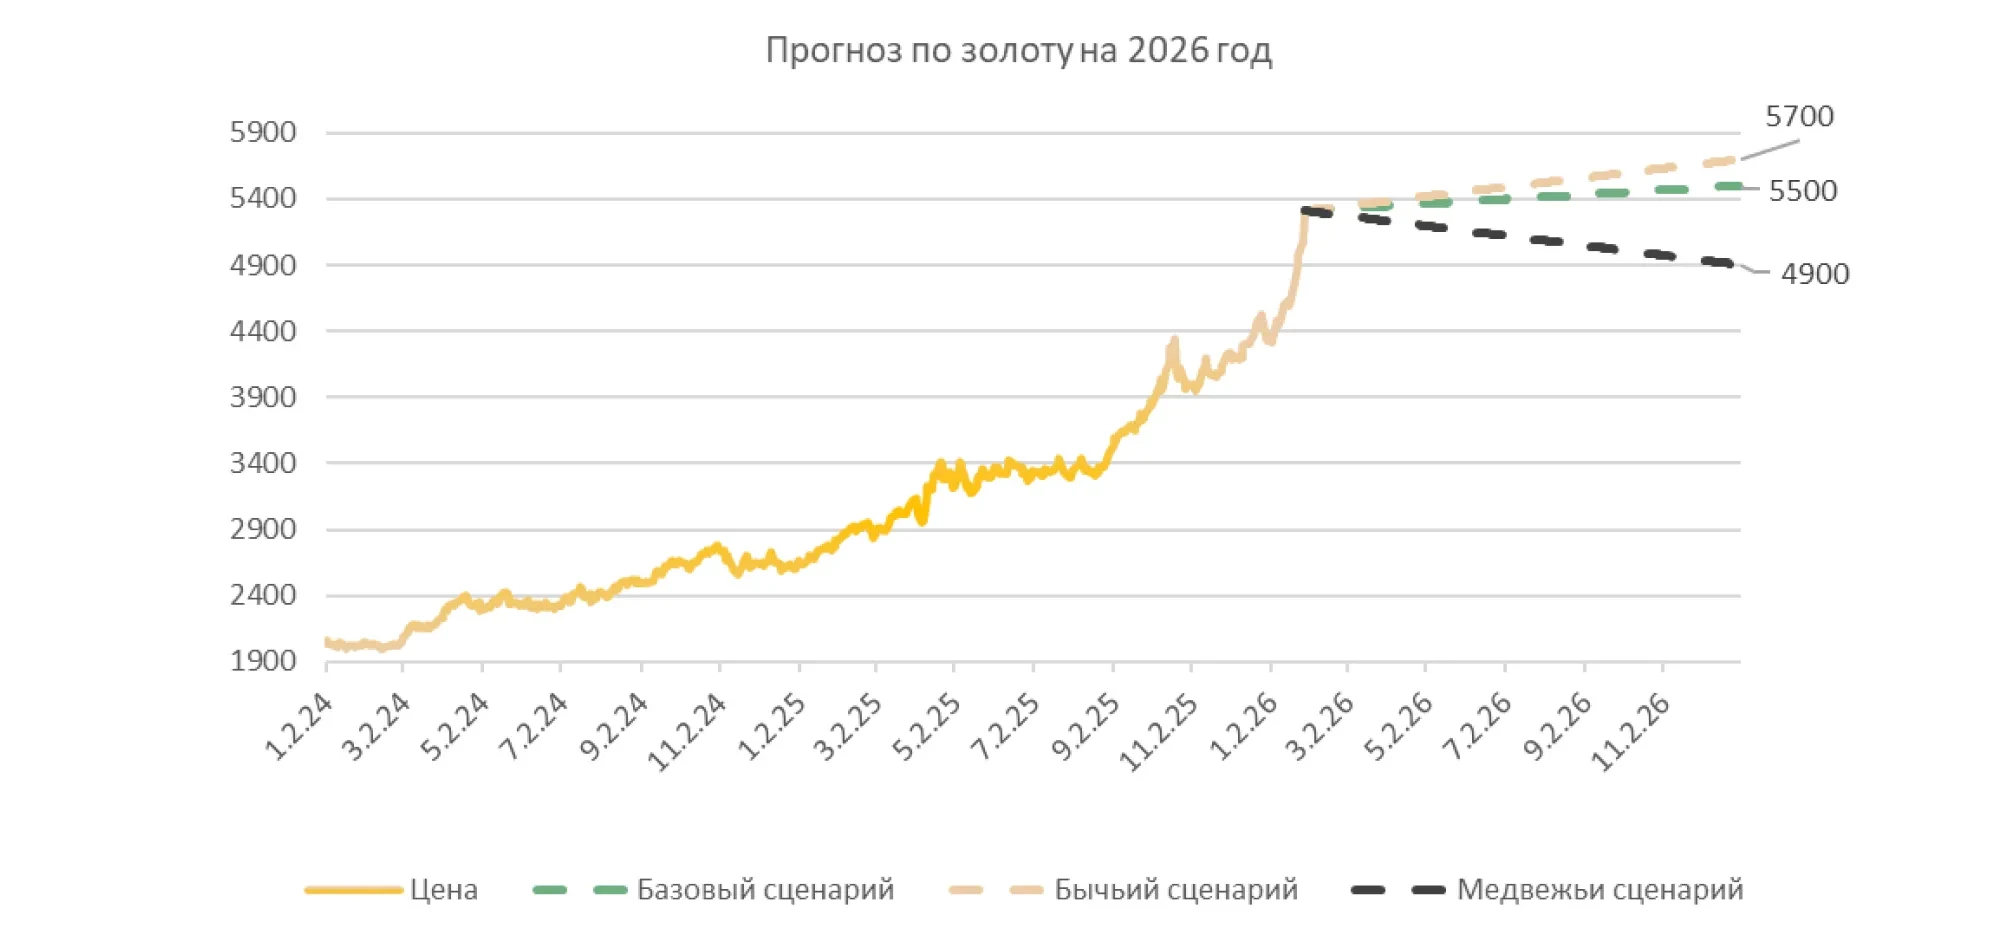
In our baseline scenario, we assumed that the price of gold could rise to around $4,900 per ounce during the current year. However, the market has realized this growth much faster than expected: under current conditions, gold is growing at an accelerated pace, and at the moment the price is already close to $5,200. This means that the initial baseline trajectory has effectively been “completed” ahead of schedule, and the risk of the final range for the year shifting upward has increased significantly.
Subject to this, we are revising our benchmarks. While our baseline scenario initially implied $5,200 at the end of the year, such a sharp and rapid upward movement prompts us to raise our target price to $5,500 per ounce. In the bullish scenario, with the geopolitical risk premium remaining high, steady investor demand, and continued purchases by central banks, we see potential for prices to reach $5,700 by year-end. In an adverse scenario (normalization of expectations, profit-taking, a partial reduction in the risk premium, and a stronger USD), the key downside anchor remains a range close to the previously anticipated level of approximately $4,900 per ounce.
The balance of these factors suggests that gold is expected to continue to play an important role in strategic portfolios under the baseline scenario, and even more so under stress scenarios materializing.
Silver: Results of the Year
The silver market in 2025 evolved under similar macroeconomic trends as gold but showed even more impressive dynamics. Against the backdrop of the “gold rally,” silver made a powerful surge, traditionally outpacing gold in terms of volatility. By year-end, silver prices had risen by nearly 140% since the beginning of the year, while gold was “limited” to a 63% increase over the same period. Throughout the year, silver experienced sharp fluctuations, with periods of rapid growth followed by pullbacks.
For example, following a series of record highs in the autumn, silver experienced its largest single-day decline in a decade (-6.6% in one session) in October, as some investors took profits amid concerns of an overheated market.
Nevertheless, fundamental factors supported the upward trend, and the pullbacks attracted new buyers, the FOMO effect (“fear of missing out”) was evident in the silver market as well. As a result, 2025 became one of the best years for silver in modern history: in terms of returns, the metal significantly outperformed gold.
The Gold/Silver ratio fell from 105 at the beginning of the year to 70 in December, reaching its lowest level in several years. A decline in this ratio signaled the faster growth of silver price and that institutional investors regained interest in previously undervalued silver, following a prolonged period when gold had significantly outperformed silver.
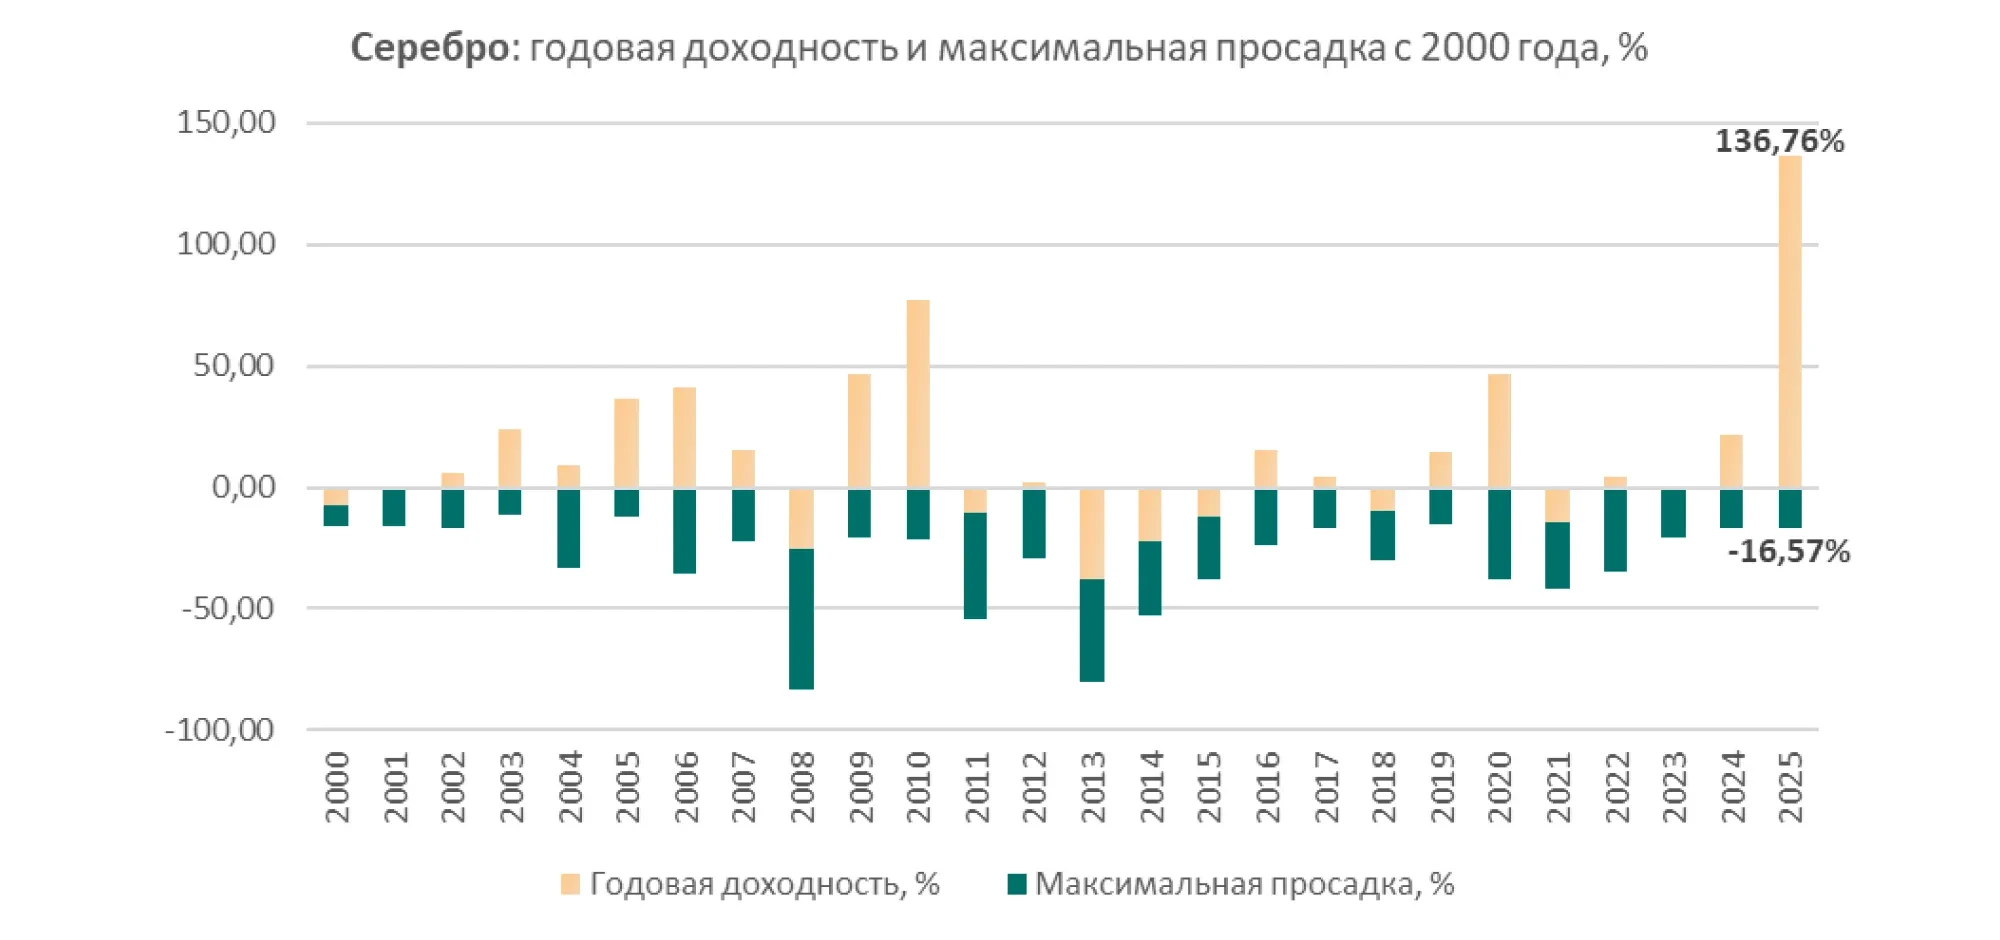
Source: Bloomberg; Calculations and Visualization: BCC Invest.
Such impressive growth in silver prices in 2025 was driven by a combination of investment and industrial factors.
On one hand, silver, like gold, saw a significant inflow of funds from investors seeking protection against inflation and geopolitical risks. In anticipation of Federal Reserve policy easing, investors actively purchased precious metals.
As a result, substantial capital returned to silver ETFs in 2025, and global holdings of these funds are expected to recover to previous record highs (around 1.021 billion ounces).
An additional driver of capital inflows was the relative pricing imbalance: at the start of the year, silver appeared inexpensive relative to gold (with the G/S ratio > 100). As a result, some investors viewed silver as a more affordable alternative to gold with greater upside potential. The increase in investment demand for silver was particularly pronounced in Asia and among private investors, who were attracted by the metal’s relative affordability.
On the other hand, industrial demand for silver reached new highs driven by structural trends. Silver is widely used in high-tech industries, primarily in the production of solar panels, as well as in electronics, electric vehicles (hybrid and electric vehicles), and various electrification systems. The rapid expansion of the renewable energy sector became one of the key drivers: following record levels of solar capacity installations in recent years (especially in China), demand for silver for photovoltaic panels rose to an all-time high. At the same time, the development of electric vehicles and related infrastructure (charging stations and in-vehicle electronic systems) further boosted industrial consumption of silver, as the metal’s unique electrical and thermal conductivity is critical for the electronics industry.
Thus, the energy transition and the technological boom have provided the silver market with a powerful fundamental boost. According to ING estimates, more than half of total global silver demand now comes from industrial uses, setting it apart from other precious metals (by contrast, gold demand is dominated by investment and jewelry). In 2025, industrial consumption of silver continued to grow, although by year-end the first signs of a local peak began to emerge – in particular, in China, where the pace of new solar capacity additions is likely to stabilize after a period of extreme growth.
This combination of steady industrial demand and investment inflows unfolded against limited scope for increasing silver supply, resulting in a market deficit.
2025 marked the fifth consecutive year in which global demand for silver exceeded supply from mining and processing.
Silver: 2026 Prospects and Risks
In 2026, favorable conditions for silver are expected to continue, although the pace of price growth is likely to normalize following the extreme surge of the previous year. Fundamental support for the market remains strong: the physical balance is still in deficit, while the macroeconomic environment (monetary policy easing, a weaker U.S. dollar, and persistent geopolitical uncertainty) is stimulating investor interest in precious metals.
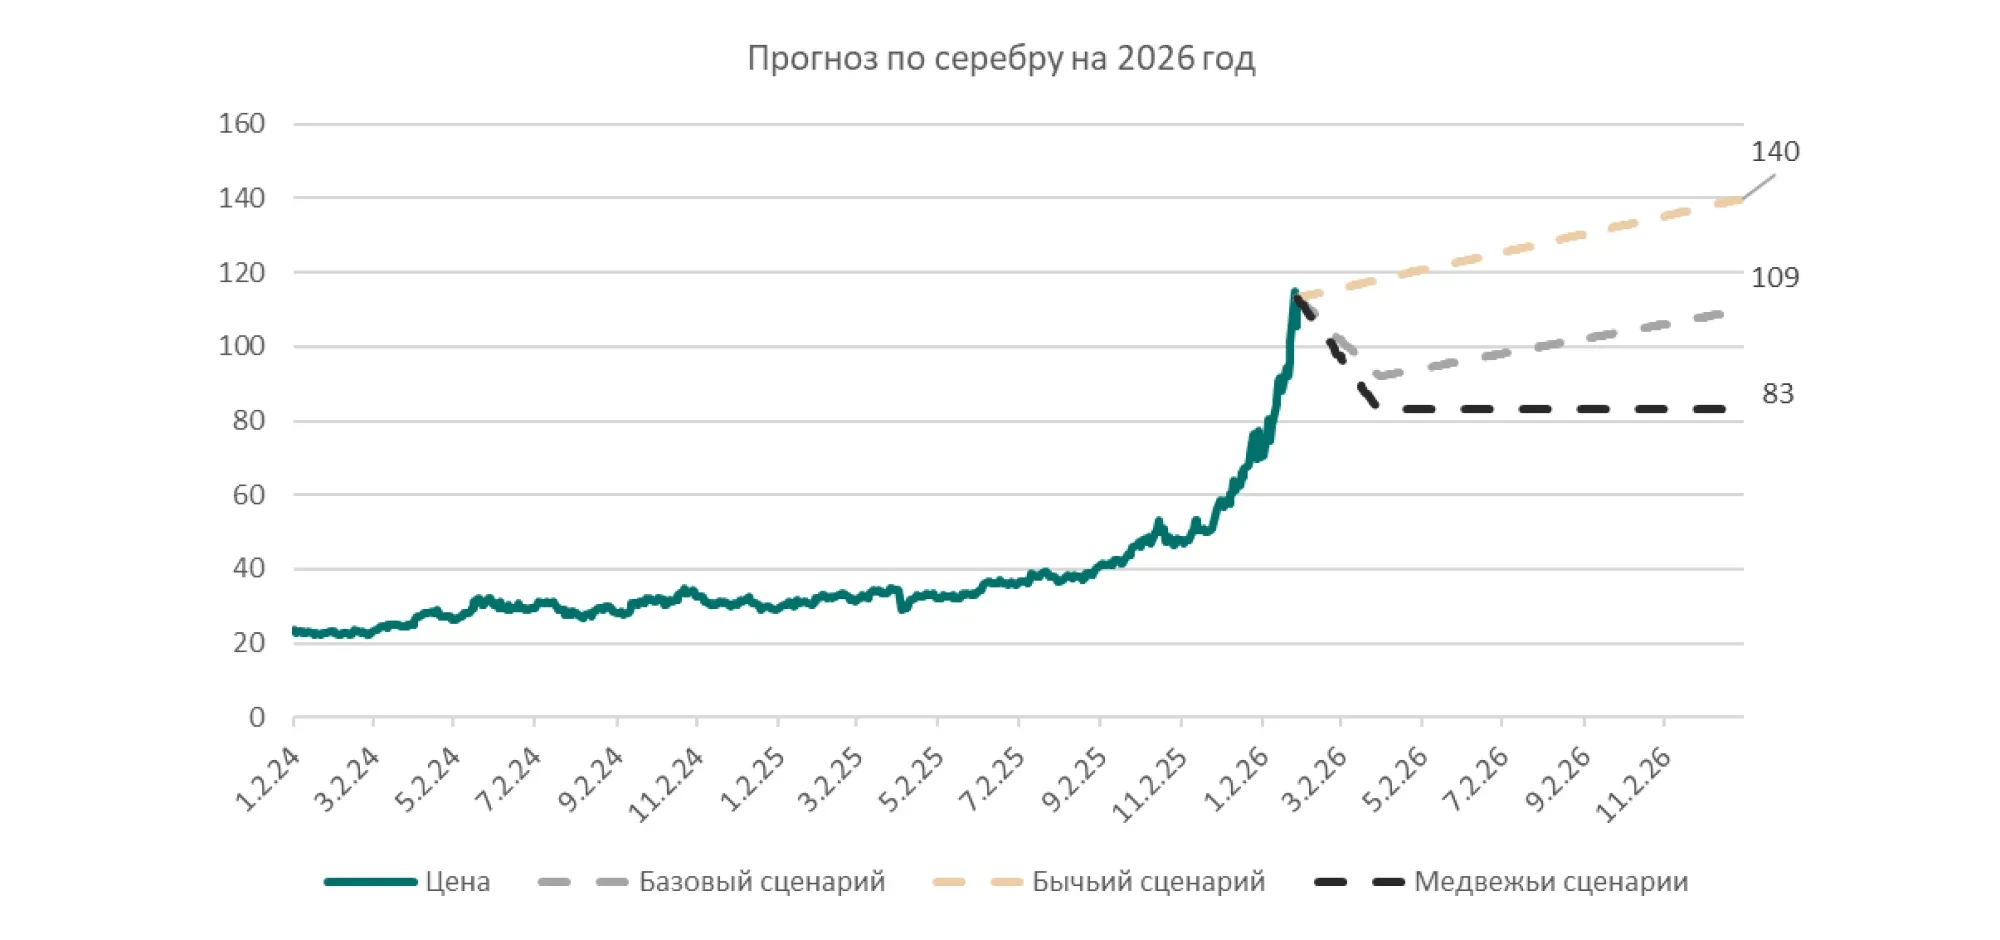
Conclusion on silver: the baseline forecast for 2026 is for prices to remain high, supported by a combination of investment and industrial demand. It is important to note that silver has been rising as dynamically as gold in recent weeks, and the market is showing increased sensitivity to news and capital inflows into precious metals. This increases the likelihood of wider price ranges throughout the year and makes a scenario-based approach particularly important.
In our baseline scenario, we expect that after sharp growth and acceleration of the rally, the metal will go through a correction phase: the most likely pullback range is $83-92 per ounce. Further, with the deficit balance and steady industrial demand (solar energy, electrification, electronics) remaining in place, prices are likely to return to current levels, which we estimate at around $110 per ounce.
In a bullish scenario, if the current dynamics continue and strong investment demand (including ETFs and speculative capital) persists, silver could remain extremely volatile and trade in an extended range of $125-140 per ounce by the end of the year.
In a bearish scenario (“risk-on” cooling, profit-taking, dollar appreciation, or worsening cyclical backdrop), silver may get stuck in the $83-92 range following the correction, without a rapid recovery to higher levels.
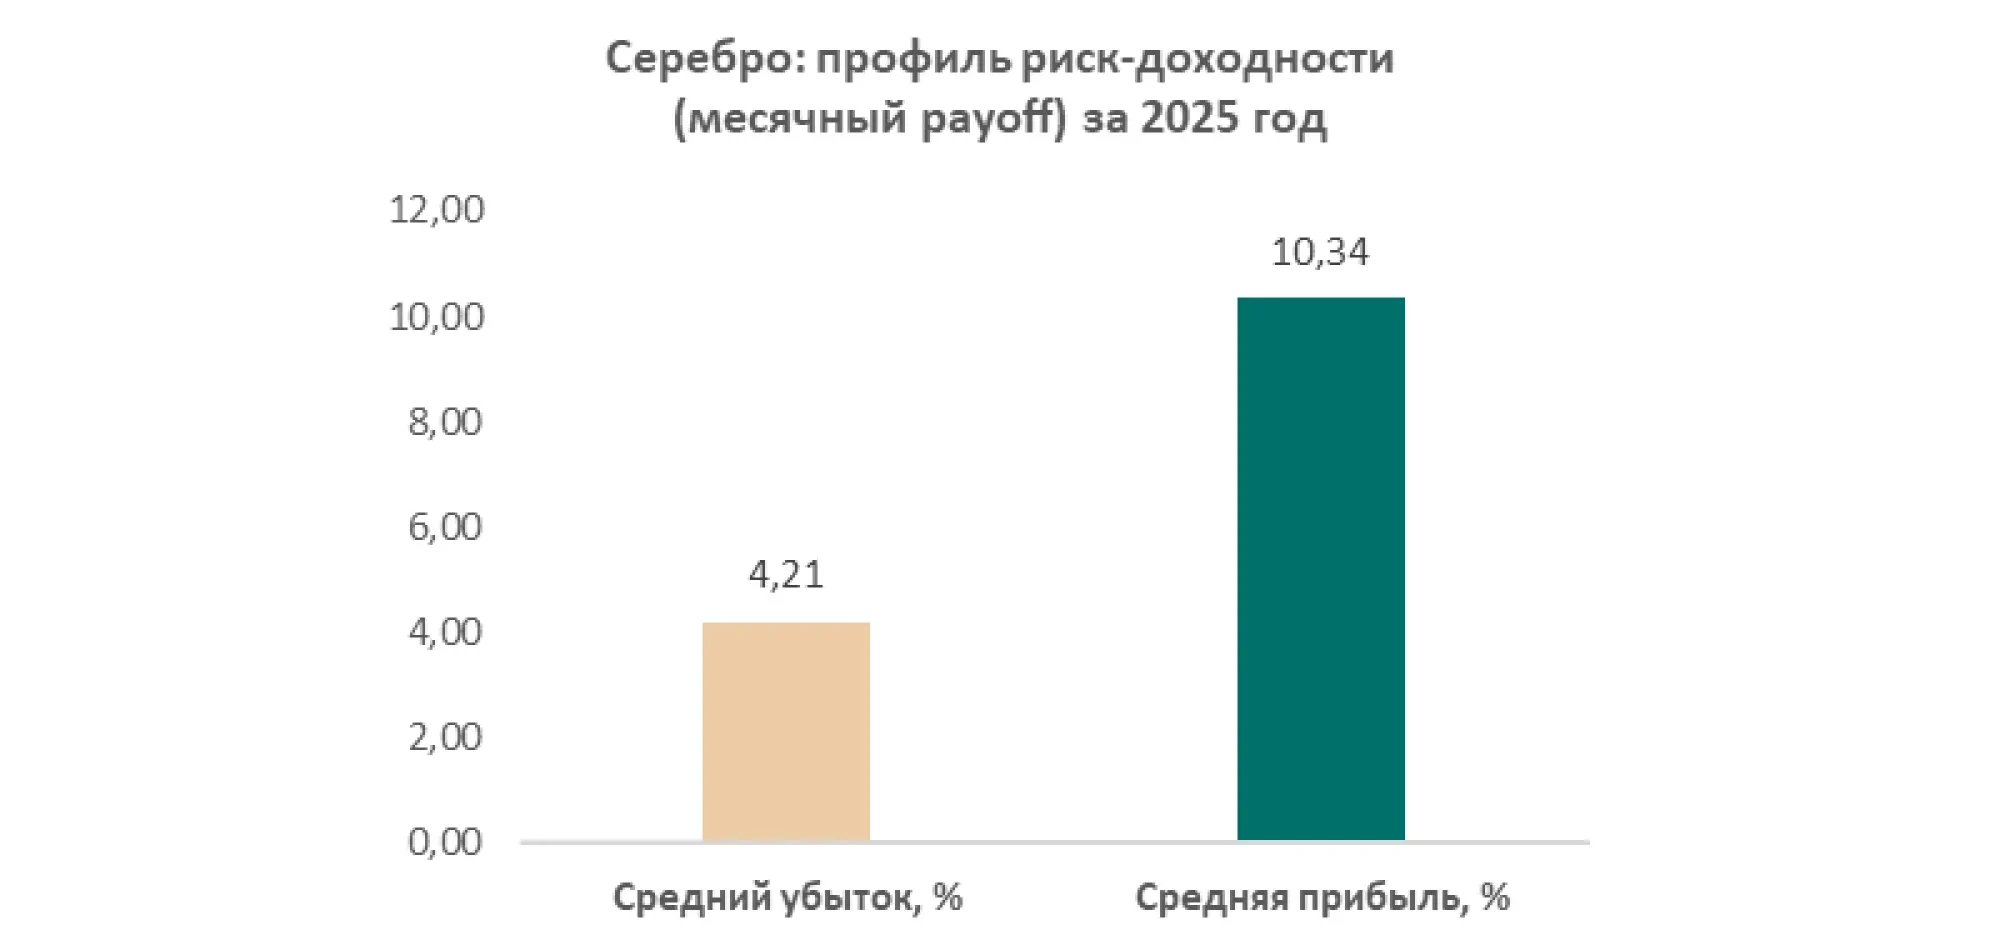
Thus, silver remains a riskier and more volatile asset than gold: it can significantly boost portfolio growth during rally phases, but can correct just as quickly when market sentiment shifts.
An additional factor that may constrain unrestrained growth is the response of industrial consumers to a prolonged period of elevated prices. Industries where silver represents a significant cost item (most notably solar panel manufacturers) may, if high prices persist, increasingly adopt technologies to reduce silver consumption or seek partial substitutes. This could temper the pace of growth in industrial demand in 2026, even if the broader energy transition trend continues.
During market upturns, silver can outperform gold, delivering excess returns, as was the case in 2025. However, during downturns, it often falls faster and deeper, suffering from both a speculative capital outflow and a decline in real industrial consumption.
Platinum: 2025 Results
In 2025, platinum rose along with other precious metals, but appeared less expensive compared to gold and silver. Analysts noted that the platinum market was gradually shifting toward a deficit situation, where demand began to exceed supply.
The improvement in the platinum supply-demand balance was highlighted separately. Against this backdrop, the metal received more stable support, while palladium's growth was estimated to be limited by its high dependence on industrial demand.
2026 Prospects and Risks
In 2026, the key factor for platinum remains the supply and demand balance. If the deficit persists, even a moderate increase in demand or supply disruptions could have a notable impact on prices, as the ability to rapidly expand supply is limited.
Additional support may come from the continued substitution of palladium with platinum in automotive catalysts. This is facilitated by the lower cost of platinum and technological changes in the industry that are redistributing demand within the precious metals group.
Constraints for platinum in 2026 are primarily linked to the state of global industry and the automotive market.
The economic slowdown and decline in the production of internal combustion engine vehicles are reducing the demand for catalysts and, consequently, for platinum. The accelerated transition to electric vehicles is also reducing the consumption of metals associated with exhaust gas purification.
Platinum: Conclusions
The baseline scenario for 2026 assumes a more stable supply-demand balance than for palladium and the potential for moderate growth if the deficit persists. At the same time, platinum remains sensitive to industrial activity, so the range of possible outcomes in 2026 will depend on macroeconomic dynamics.
It is also important to consider the entry point: in 2025, platinum rose by 123%, meaning that the market is entering 2026 after a very strong rally. Against this backdrop, consensus forecasts (Bloomberg, as of January 28, 2026) project a significantly more restrained trajectory for platinum by the end of 2026: the median for Q4 2026 is around $1,675/oz, with a very wide range of estimates from $1,150 to $2,700. Among the major institutions, the range of expectations is also diverse: JPMorgan is targeting approximately $1,650 for Q4 2026, Morgan Stanley around $1,850, Citigroup around $2,100, Standard Chartered around $2,450, and Commerzbank up to $2,700 (Q4 2026).
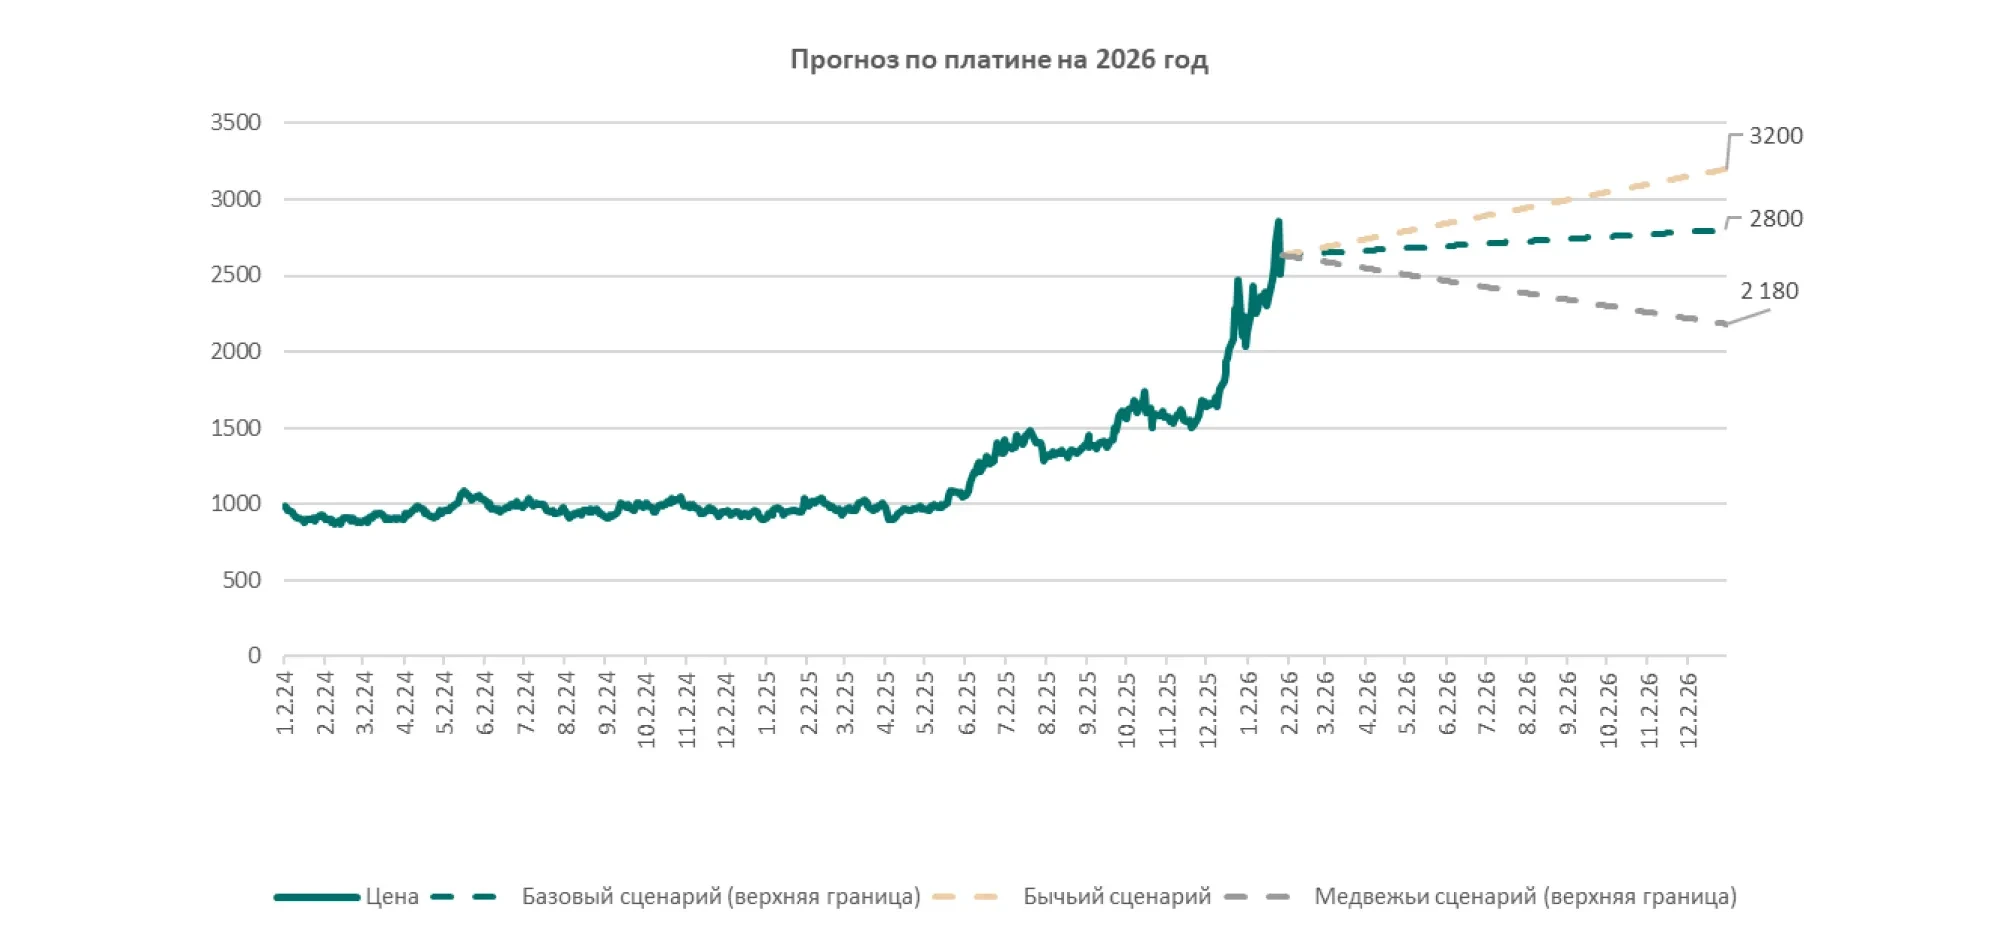
Contrary to the current consensus, we believe that after such a sharp price increase in 2025, the market may remain highly volatile and maintain a higher “deficit premium” if the physical balance remains tight and investment demand continues.
Therefore, our platinum targets for the end of 2026 are as follows:
Bullish scenario: $3,200/oz (continued deficit + active investment demand/supply risks).
Baseline scenario: $2,500–2,800/oz. (growth rates normalize, but structural support remains).
Bearish scenario: correction and trading within the range/corridor of $1,900–$2,180/oz (partial unloading of risk premium, weaker industrial demand, USD strengthening/tighter financial conditions).
Palladium: 2025 Results
In 2025, palladium looked weaker than gold and silver. The metal is more dependent on industrial demand, primarily from automotive catalysts, and some emissions-reduction processes do not increase demand for palladium.
The growth in sales of electric vehicles not requiring palladium for exhaust gas purification, remained a negative factor. At the same time, the substitution of palladium with platinum in catalysts continues due to the platinum’s lower cost, which further dampened demand for palladium.
According to analysts' estimates, palladium was close to its marginal production cost, which usually limits the depth of price declines. In addition, low inventory levels prevented the decline, despite the fact that the price remained above long-term averages.
2026 Prospects and Risks
In 2026, the fundamental demand drivers for palladium remain moderate. With the continued growth of electric vehicles and the ongoing trend of substituting palladium with platinum, consumption in the automotive sector may decline or grow at a slower pace.
A scenario of sustained palladium price growth requires either a recovery in the production of internal combustion engine vehicles or a significant reduction in supply while stocks remain low. In a more neutral scenario, prices may move within a relatively narrow range close to production cost levels.
Palladium: Conclusions
For 2026, palladium appears to be a metal with limited growth potential and high dependence on industrial dynamics. Price declines are limited by proximity to marginal production costs and current inventory levels, but structural changes in the automotive sector and the substitution of palladium with platinum continue to weigh on demand.
From the perspective of market consensus (Bloomberg, as of January 28, 2026), palladium expectations for the end of 2026 remain restrained: the median forecast for Q4 2026 is around $1,357/oz, with estimates ranging from $1,100 to $2,100. Some major institutions are already projecting a lower trajectory for 2026 quarters: for example, JPMorgan's estimates indicate a decline to $1,150 in Q4 2026, Morgan Stanley - around $1,250, while Commerzbank (around $2,100 in Q4 2026) and a number of other players are more optimistic, assuming more stable prices should the geopolitical premium persist and/or supply disruptions occur.
Our Opinion
We believe that after the sharp correction of previous years and against the backdrop of high market sensitivity to any supply disruptions, palladium may trade above consensus levels, but its growth potential is indeed limited by structural demand factors.
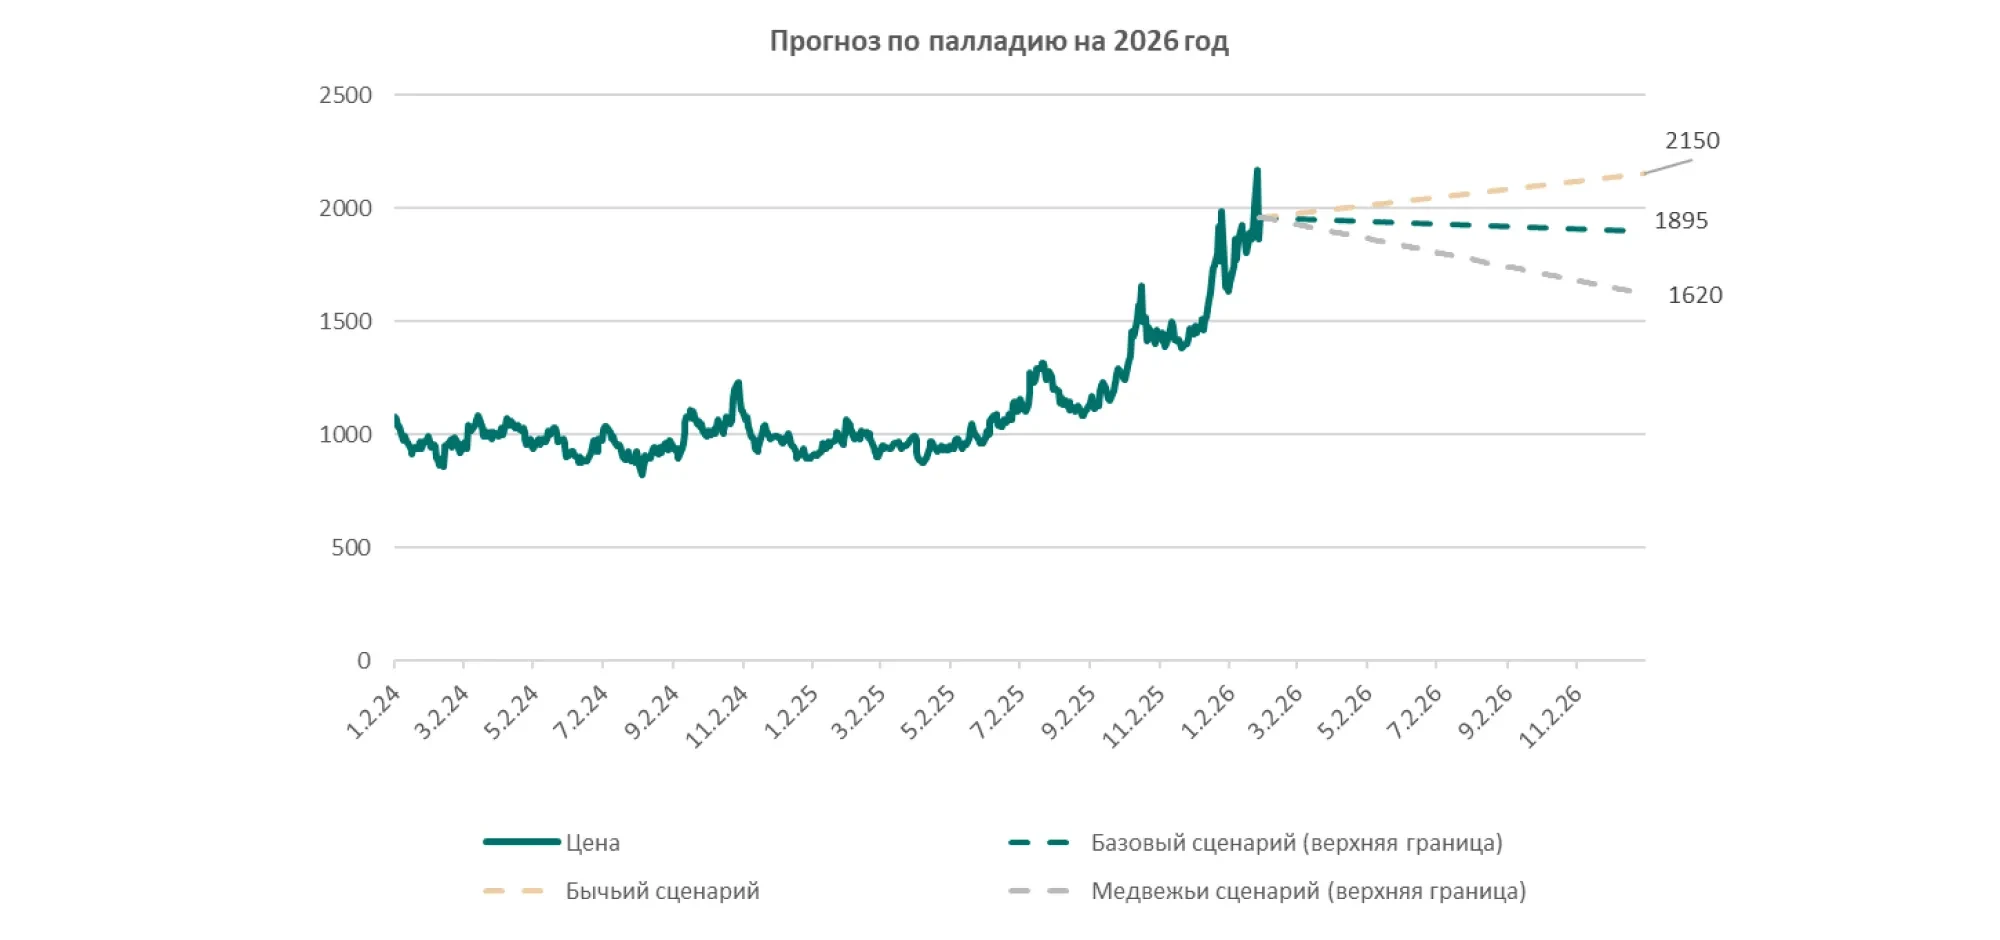
Based on this logic, our targets for 2026 are as follows:
Baseline scenario: trading within $1,620-1,895/oz range (moderate support due to cost/supply risks, but without sustained demand impulse).
Bullish scenario: $2,150/oz (realization of supply risk premium: supply disruptions/sanctions risks + volatile investment demand).
Bearish scenario: correction and consolidation within the range of $1,500-1,620/oz. (accelerated substitution with platinum, weaker auto demand, tighter financial conditions).
Key factors to monitor in 2026: dynamics in sales of internal combustion engine and hybrid vehicles, the pace of transition to electric vehicles, the scale of palladium substitution with platinum in catalysts, inventory levels, and potential supply disruptions among major manufacturers.
Important Information. Disclaimer.
Risk Information for JSC BCC Invest Customers
Important Information:
This material is distributed for informational purposes only. The distribution of this material does not constitute an investment advisory activity. The information contained herein is not a personalized investment recommendation. The Recipient of this material should not rely solely on the information provided to make decisions. Calculations, historical data and other information that may be contained herein have been prepared by JSC BCC Invest employees based on publicly available information and data. JSC BCC Invest does not verify and has no obligation to verify the completeness, accuracy and reliability of such information. Any information provided by JSC BCC Invest should be used by the Customer solely at the Customer’s discretion and risk.
The information provided by JSC BCC Invest does not constitute an offer to purchase and/or an obligation sell any securities, an inducement to complete a transaction, or a recommendation to the Recipient on investment, tax and legal issues, including the suitability of the transaction for the Recipient’s specific objectives.
Before carrying out any transactions in securities, including foreign securities, currency, and derivative financial instruments with various types of underlying assets (hereinafter referred to as "Financial Instruments"), information on which is provided by JSC BCC Invest, the Recipients of such information must review the documents that characterize the specified Financial Instruments (an issue prospectus, etc.) and to conduct comprehensive consultations with their financial, legal, tax, accounting, and other advisors before concluding a transaction in Financial Instruments. Conclusion of transactions in Financial Instruments involves certain risks, for which JSC BCC Invest cannot be held responsible, as they are beyond the reasonable control of the Parties, and their ability to foresee and prevent the consequences of such risks is limited or impossible. The Recipient must independently assess the possibility of entering into transactions involving Financial Instruments. The Recipient should not enter into a transaction if its economic and legal substance, documentation, terms and conditions, and associated risks remain unclear or inconsistent the Recipient’s objectives, intentions, and expectations. Transactions in financial instruments may cause significant financial and other risks. For this reason, these transactions are intended for persons who are willing to accept the risks involved and are capable of bearing possible financial losses. Before entering into any transaction, the Recipient must ensure that they understand the risks associated with the relevant transaction and possess the necessary financial and other resources to fulfill the obligations assumed under any scenario. When making a decision to conduct a transaction on the financial market, it is necessary to take into account that investing in financial instruments carries the risk of not earning the expected returns, partial or even total loss of invested funds, as well as possible expenses and losses. Information about anticipated positive returns may be nothing more than assumptions. Past investment performance does not determine future results, and the value of assets can both increase and decrease. Fluctuations in foreign currency exchange rates may also result in decreased or increased cost of investments. JSC BCC Invest makes no warranties or representations and accepts no responsibility with regard to financial results that the Recipient may have based on the information provided.
Conflict of Interest
Please be notified that JSC BCC Invest provides services similar to those described in the standard forms of Brokerage and Nominal Holding Service Contracts to third parties, accepts third-party orders under other Contracts and carries out deals and other transactions in securities and other financial instruments in the interests of third parties and in its own interests and renders other services to third parties through combining the types of professional activities according to the applicable laws of the Republic of Kazakhstan, including information services, financial advisory services, underwriting services, bondholder representative services, asset management and market maker services.
In the course of rendering the above services, JSC BCC Invest receives fees for such services, which may lead to a conflict of interest between JSC BCC Invest and the Customer.
JSC BCC Invest does not recommend the Customer to make transactions in financial instruments, if execution of such transaction gives rise to a conflict of interest.
State License No. 3.2.235/12 dated 10 July 2018 for carrying out activities in the securities market
BCC Invest JSC
